send link to app
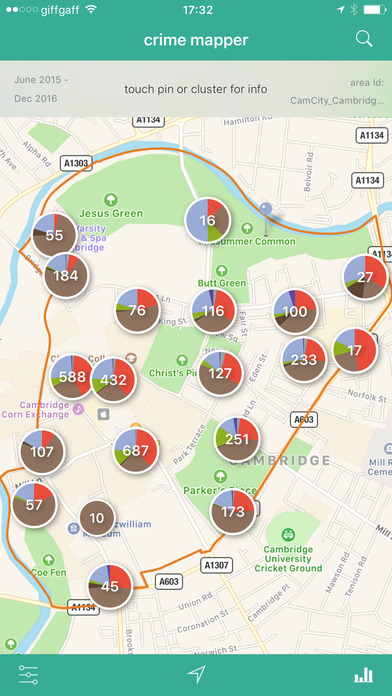
A data visualisation tool that adds publicly available crime data from UK police forces to an interactive map. You can look at crime data for your local area, or show data for specific regions. You can also create pie-charts, bar graphs and line graphs to show the different categories of crime being committed in an area, and chart changes over time. The data in this app is available for England and Wales and is released under an Open Government license.


